TOOLS
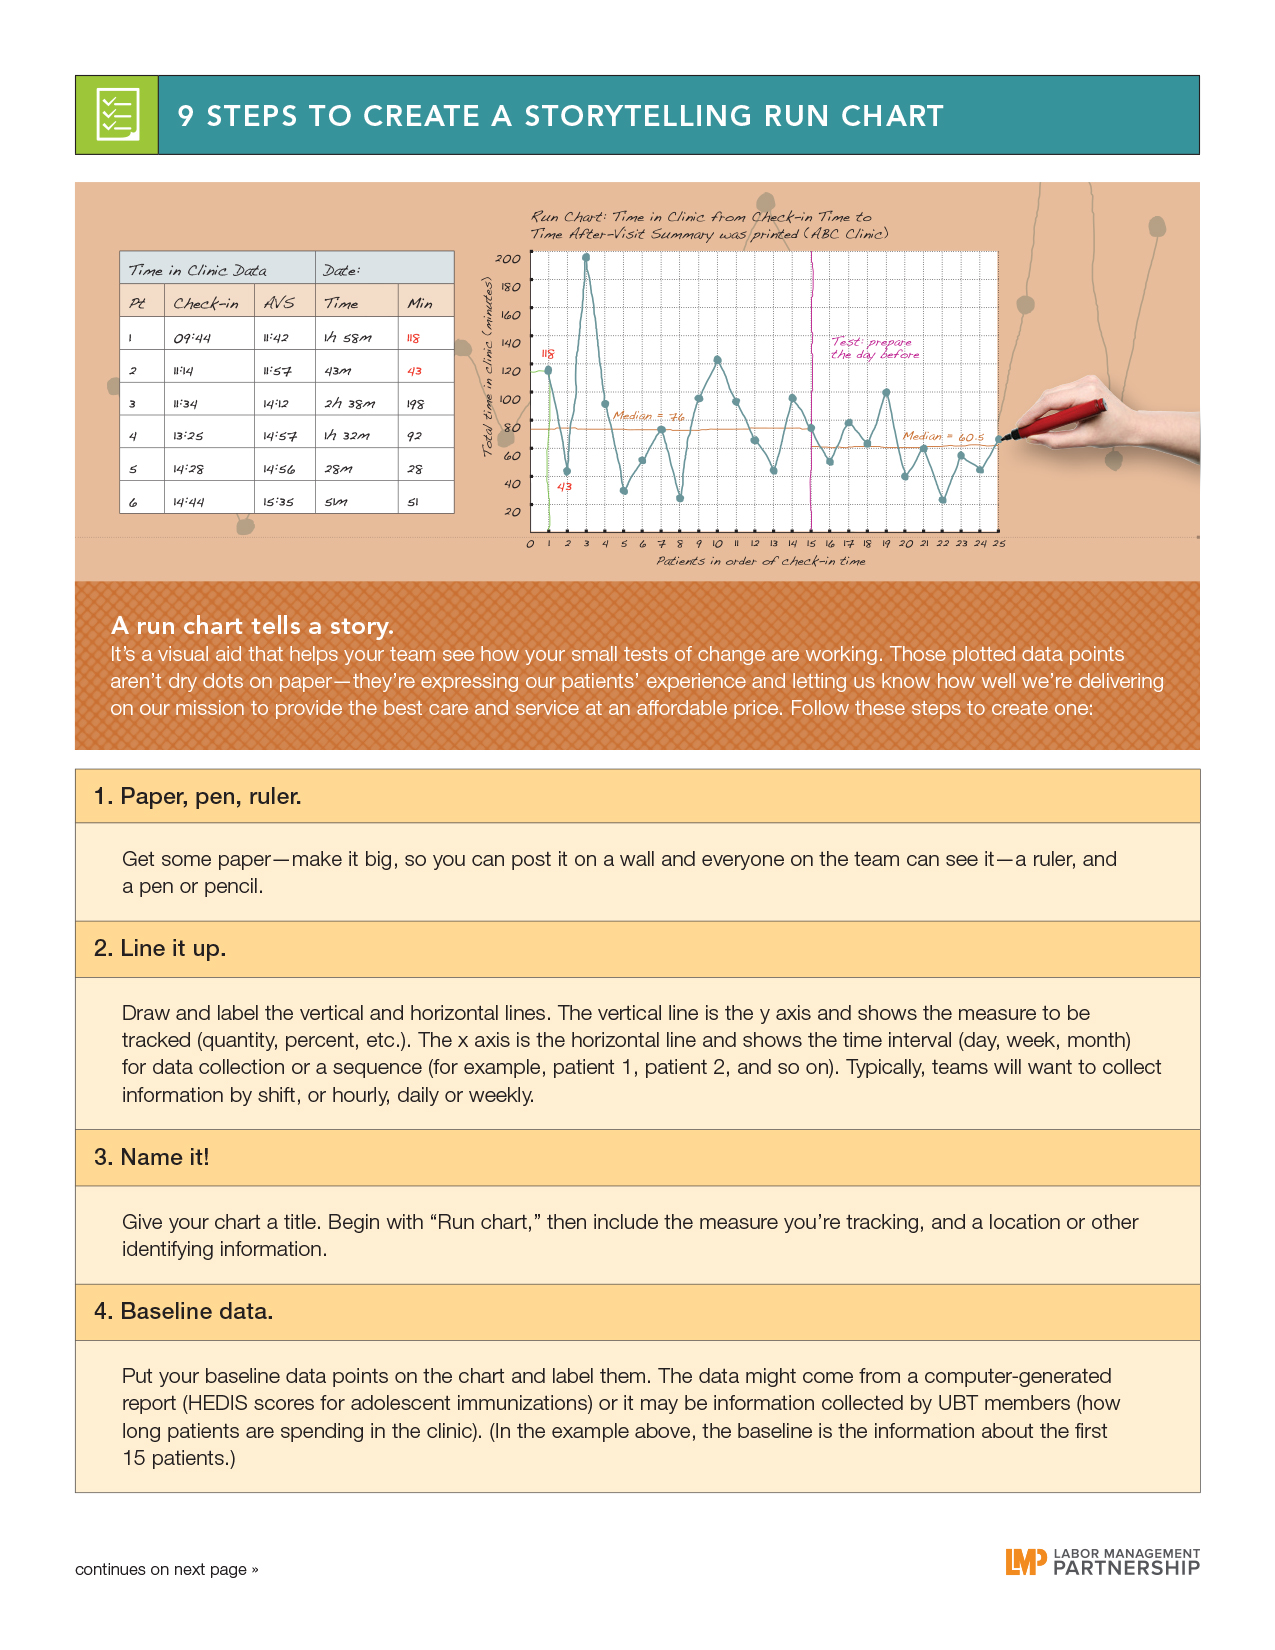
Nine Steps to Create a Storytelling Run Chart
Format:
PDF
Size:
8.5" x 11"
Intended audience:
UBT consultants and co-leads
Best used:
Follow these step-by-step instructions to make a run chart from your UBT's data, creating a visual display that shows how your team's tests of change are working.