hank

Help Video

How to Find UBT Basics on the LMP Website

Learn how to use the LMP website:

LMP Website Overview

Learn how to use the LMP website:

How to Find How-To Guides

This short animated video explains how to find and use our powerful how-to guides

Learn how to use the LMP website:

How to Find and Use Team-Tested Practices

Does your team want to improve service? Or clinical quality? If you don't know where to start, check out the team-tested practices on the LMP website. This short video shows you how. 

Learn how to use the LMP website:

How to Use the Search Function on the LMP Website

Having trouble using the search function? Check out this short video to help you search like a pro!

Learn how to use the LMP website:

How to Find the Tools on the LMP Website

Need to find a checklist, template or puzzle? Don't know where to start? Check out this short video to find the tools you need on the LMP website with just a few clicks. 

Learn how to use the LMP website:

Manager Sponsor Profile: Linda J. Bodell

Deck: 
Helping teams do their best work

Story body part 1: 

Linda J. Bodell has a simple formula for being a good sponsor of unit-based teams: Show up. Be of service. Clear a path. Bodell, a former clinical nurse specialist, spent much of her career in critical care settings where patient cases are often unstable and complex. She learned to be watchful and attentive. Today, those lessons define her as a sponsor of four teams at the Fontana Medical Center. She meets with her teams and her labor partners each month. Her personal goal is to understand what works and what doesn’t—and to get to the “why.” Bodell’s teams praise her for guiding them through facility and regional business goals, yet trusting the teams to find solutions that deliver needed results. She talked about being a sponsor with LMP senior communications consultant Anjetta McQueen.

Bodell was clinical director of Medical-Surgical Services at the time this article was written; she is now director of Clinical Care.

Q. Please share one of your best practices.

A. Show up at every team meeting, even if it’s only just one 15-minute window. It’s once a month per team. It’s essential. There is no substitute for being present. Let your teams tell you what they are currently working on. You tell them what’s going on…because they need it to complete their projects successfully. They haven’t had a bloodstream infection in 16 months? They need to hear where they are being successful.

Q. Would you describe an instance when you removed a barrier?

A year and a half ago, an RN and PCA (personal care attendant) from one of my teams asked to get a blood pressure machine that could stay in the patients' rooms. I did that—we had a department closing. I acquired a unit that could stay in one of the isolation rooms. It’s just those little things that make a difference in their work experience every day.

Q. Are there aspects of your past experience that have enhanced your sponsorship?

A. I have served on several nonprofit boards and as a volunteer, in different areas of health care and in Oman and South America, and that’s about taking a service to people, and it’s the same thing I do here as a sponsor. It’s my job to serve them so that they have everything they need to do their job the best they can. I know they care about their patients and their colleagues. They need to know that I care about them and what they do, and that it matters.

Q. Have your teams ever solved something you thought was unsolvable?

A. I would ask them! But the 4 West Med-Surg team was having a difficult time with workflows and getting to their supplies. They work where there are long hallways, where the 34 beds are arranged in a rectangular shape around the unit. This did not look like a process that could be fixed. They did the spaghetti diagram on how many steps nurses take. And the staff, together, made decisions about how to change, where they have their supplies, and how they were arranged. They worked on their workflow. Now the service scores are phenomenal.

Q. What inspires you each day in your duties as a sponsor?

A. So when you know what the goals are and what the actual plans are, and you go out and round on the department, and you can see those in living proof. It’s just exciting to see that this process really affects practice and activity at the unit level.

Words from the front line

“She really has an open door and an open heart. Linda has been a wonderful mentor. She is patient and stays calm under pressure. She knows how to lead you without just handing you the answers. She keeps you focused on what’s important.”—Letty Figueroa, RN, assistant clinical director and management co-lead, 4 East Med-Surg UBT, Fontana Medical Center

TOOLS

Hank Libs: Calling on Sponsors!

Format:
PDF

Size:
8.5" x 11"

Intended audience:
Frontline workers, managers and physicians

Best used:
This "Hank lib" provides some variety and fun at a team meeting while highlighting the importance of sponsorship.


Related tools:

Six Tips for Successful Interest-Based Problem Solving

Story body part 1: 

Michael Hurley was the education director for the Coalition of Kaiser Permanente Unions for several years, and he and his team designed many of the LMP programs used to support unit-based team education. 

1. Know why we use interest-based problem solving

Interest-based problem solving (IBPS) is a collaborative approach to solving problems, a process for negotiating differences amicably without giving in. When you’re in an ongoing partnership—whether it’s a labor-management partnership or, say, a marriage—you likely have multiple objectives you want to satisfy when resolving differences. Those include not only the desire to solve the problem in a way that meets your needs, but also to solve it in a way that doesn’t cost too much (in time, money or emotional wear and tear), and that leaves the relationship intact or even improves it. Because down the road, you know you’re going to be working together again to solve the next problem that crops up.

2. Understand key terms

Four words are at the heart of the interest-based process. The issue is the problem or subject area to be addressed. A position is a proposed solution. The interest is the underlying need, motivation or concern that may have to be addressed in order to reach a solution; you can tell an interest in part because there is usually more than one way to satisfy it. An option is a potential way to address the issue, in whole or in part.

Your position tells us what you want but not necessarily why you want it.

  • A spouse wants to put 5 percent of income into a retirement savings account.
  • A parent wants a child in bed by 9:30 on a weeknight.
  • A union wants a 3 percent across-the-board wage increase in collective bargaining.

Your interests tell us what is important to you.

  • A spouse wants enough saved to have a comfortable retirement.
  • A parent wants a child to be well rested for school the next day.
  • A union rep wants a compensation package for members that aids recruitment and retention.

3. Ask: Is that ‘interest’ really a position?

What do you do when you’ve got a position masquerading as an interest? Usually, you can get to the interests that underlie a position if you listen carefully and ask the right questions. Find out the needs and concerns behind the position. Here’s an example:

Statement by wife: “I hate living in Los Angeles. We should move to Oregon.”

Reaction to self: “Great, here we go again.”

Question to wife: “Why should we move to Oregon?”

Answer: “We’re in a rut. We’ve lived our whole lives here. I’m tired of it.”

Question: “What else appeals to you about Oregon?”

Answers: “The weather is too hot here, and we spend so much time stuck in traffic. We have to do all our exercising here at the gym. Oregon is cooler and there are prettier roads for biking. We can get to the woods and good hiking faster. People are more relaxed there. “

Interests: Change in weather, less traffic, easier access to uncrowded outdoors, less stress.

By starting with a discussion of interests, the parties can talk about what is important to them without staking out what they want the outcome to be. It opens the door to collaborative problem solving, as opposed to competition or compromise. 

4. Agree on the information

Find agreement on what data to collect and how to collect it, vet it and report it—or you’ll just argue about the data. 

5. Make an action plan

Create an action plan for turning solutions into reality. Be clear on who’s accountable for what. Establish a timeline. 

6. Set ground rules

Remember, interest-based processes don’t always work. In my experience, they have the best chance for success if the parties agree to:

  • Focus on the issue, not personalities.
  • Share information fully and early.
  • Listen actively.
  • Work hard to meet interests, not sell positions.
  • Be open to options.
  • Look for ways to build trust.

Wasted Linens Are an Unnecessary Expense

Deck: 
Team cuts annual costs by almost 7 percent

For a nurse on a hospital ward, it might seem quick and easy to grab the nearest sheet to mop up a spill or grab a huge stack of blankets to put in a patient’s room.

But for the Materials Management department at Panorama City Medical Center, that can be really wasteful.

And they should know. They’re the team responsible for purchasing and cleaning linens, and keeping patients comfortable.

With savings in mind, the materials UBT looked to educate other hospital staff about the true costs of buying and washing linens.

Managers and union members worked together to create a storyboard featuring photos of bed sheets used as a tablecloth at a barbeque, and price lists of supplies and laundering charges. And because the team piloted its effort in Maternal Child Health departments, it also included pictures of babies.

As the materials staff worked with the other teams, the storyboard was a big confidence booster to those who were not public speakers.

“At first I was really nervous,” says Sandra Hernandez, the team’s labor co-lead. “But then I saw people I knew in the room and that put me at ease.”

The team also reviewed linen usage and stocking levels with departments.

And their efforts paid off as they reduced the overall annual cost of linen in the Maternal Child Health department by 6.8 percent, more than three times the original goal.

They also were able to increase customer satisfaction scores in a year from 48 to 65 percent from internal clients such as inpatient units at the hospital,.

“It is important to be prepared with the data,” says management co-lead Steve Spickler. “But, you need to tell a story in addition to the charts. That’s how the UBTs make the connection between their contribution and the financial success of the organization.”

For more about this team's work to share with your team and spark performance improvement ideas, download a poster or powerpoint.

TOOLS

All in a Day's Work: Everyday Magic

Format:
PDF (color or black and white)

Size:
7.25" x 7.25" (prints out on 8.5" x 11") 

Intended audience:
Anyone with a sense of humor

Best used:
Download and post this humorous look at providing superior service on bulletin boards and in your cubicle, and attach it to emails. Have fun!


Related tools:

Behind-the-Scenes Service

Story body part 1: 

In 2011, the Medical Records unit-based team in the Northwest received 1,222,361 pages of outside records that required indexing into patients’ electronic medical records—a staggering 725,000 more pages than it received in 2010.

Yet team members met and mastered the challenges facing them, whittling down an enormous backlog and reducing the turnaround time for processing from 62 days in December 2010 to three days by December 2011—benefiting both their internal customers and KP’s members and patients. And they’re sustaining that success.

The steady increase had been debilitating. Overtime hours went through the roof, with more than 2,450 hours logged in 2010. The 37 team members work 24 hours a day, seven days a week and have seven different work classifications. Staff members were worn out. Piles of paperwork were stacked high, waiting for processing. Morale was at an all-time low.

The case illustrates vividly that service is not just a bedside issue at Kaiser Permanente. For a variety of reasons, many KP members see outside providers—and when those providers submit paper or electronic records with the patient’s medical information to Kaiser Permanente, the records have to get indexed into KP HealthConnect. If there’s a delay, the patient’s regular physician may be missing important information the next time the member is seen at KP.

“When the clinician needs medical information on their patients in order to treat their current medical condition, we’re able to provide updated and accurate records,” says the team’s union co-lead, Kathleen Boland, a data quality clerk and SEIU Local 49 member. And, she notes, members aren’t having to repeat critical tests and procedures, saving them time and money.

Things started to change when, through unit-based team training, team members learned such skills as process mapping and how to understand data. They created SMART goals (specific, measurable, attainable, realistic/relevant, time-bound), started huddling and developed a greater understanding of roles and responsibilities.

The team receives more than 700 different types of documents, so variation was rampant. Team members developed cheat sheets to standardize how documents should be prepped for indexing and to get everyone to use the same process for each task. They also cross-trained and helped each other out when someone was on vacation or ill.

“In the beginning,” says Bruce Corkum, RN, a UBT resource team specialist, “they didn’t share the work. Then they started understanding how they could help each other work toward the same goal.”

Not only did the backlog disappear, but the need for overtime is nonexistent now, they’ve improved attendance and “morale has improved,” says Burgandy Muzzy, a health records clerk and member of SEIU Local 49. People are happy to be at work.

“People are talking about us in a positive way now,” says manager Debbie Lang, “instead of as ‘those people who lose everything.’ ”

TOOLS

All in a Day's Work: Why Be Afraid of Numbers?

Format:
PDF (color or black and white)

Size:
7.25" x 7.25" (prints out on 8.5" x 11") 

Intended audience:
Anyone with a sense of humor

Best used:
Download and post the cartoon on bulletin boards, in your cubicle and attach it to emails to remind team members that numbers
—like words—tell stories.


Related tools:

How I Learned to Stop Worrying and Love the Data

Deck: 
Hank’s seven ways to conquer your fear of data

Story body part 1: 

For more than a year, the service scores at the Moreno Valley Optometry department zigged and zagged in no discernable pattern. Asked whether receptionists were helpful and courteous, 100 percent of patients answering the Ambulatory Service Questionnaire gave the highest score one month.

But two months later, only 78 percent of respondents were that enthusiastic. Two months after that, scores were back up into the 90s. The huge swings were discovered in May 2011 by Stephanie Valencia, the department’s new manager, who excavated two years’ worth of data.

“We had never looked at it before,” she says. “There was no trend. The scores were inconsistent.” Worse, says Valencia, the feedback from the most recent months was headed “on a downhill streak.”

Working with labor co-lead Gina Hitt, an optician and a member of Teamsters Local 166, Valencia and the unit-based team gathered information and set a baseline. For two days in September, the medical assistants asked all patients whether they found the receptionists to be helpful and then tallied the results.

The team used these to measure the effectiveness of a rapid string of small tests of change. These included adding a smile, positive tone of voice and eye contact on successive days. Each of those days, Hitt and her colleagues asked patients whether their receptionist was courteous and helpful. With each successive effort, the chorus of “yes” got louder and more effusive.

The act of simply examining the service scores seemed to set the team on an upward trajectory: The April 2011 score of 79.55 percent jumped to 89.09 percent in September and then 92.73 percent in October.

 “It is so neat to see how involved people are,” Valencia says. “Everyone is in sync.”

So, that’s a happily-ever-after story, right? Once upon a time, there was an optometry team in Southern California that never looked at its service scores. Suddenly, team members learned their scores were inconsistent and heading in the wrong direction. They focused on key data and tried out small tests of change. Their new practices boosted the score. Everyone lived happily ever after.

This happens every day with every UBT throughout all of Kaiser Permanente.

Right?

Maybe not.

Some UBTs are adept at using data to guide their attempts to improve performance, whether it be raising service scores, reducing infections, creating a safer workplace or boosting attendance. But for others, fear and anxiety about data and numbers are a significant obstacle on teams’ path to high performance.

In order to qualify as a Level 4 team on the Path to Performance, the team has to collect its own data and review it to see whether changes are helping improve performance. To ascend to Level 5, teams must be measuring their progress using annotated run charts.

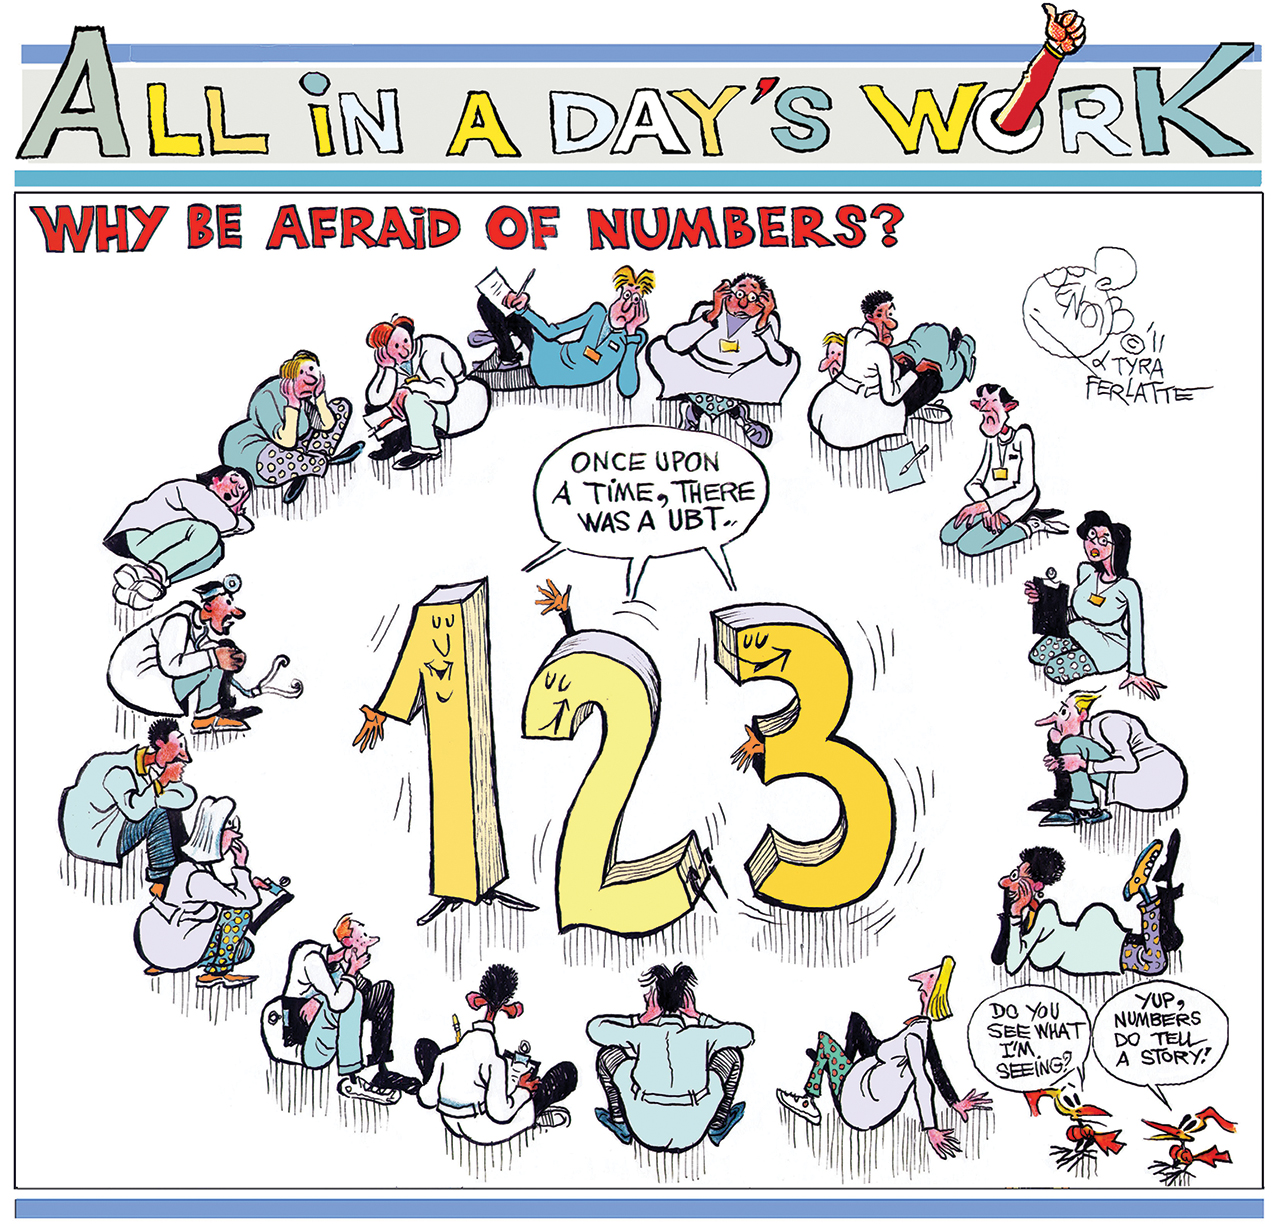
But what if you break out in a cold sweat and experience shortness of breath at the sight of anything vaguely resembling math or numbers? Do you simply resign yourself (and your team) to being roadkill on the Path to Performance?

No. Read on.

1) Realize you are plenty smart enough.  

Kaiser Permanente, like all large health care organizations, collects and stores vast amounts of data in a variety of complex databases and websites. It employs people with a huge variation in their knowledge of and comfort with data. Just because you’re not at ease with numbers now doesn’t mean you never can be.

Even Bob Lloyd, the executive director of performance improvement at the Institute for Healthcare Improvement, an independent nonprofit in Massachusetts, jokingly refers to statistics as “sadistics.”

Luckily, the data you will need to turbocharge your team’s efforts to improve performance is probably a lot less complex than you fear.

 “It’s not really ‘math’ with formulas, statistics and calculations,” says Michael Mertens, a Kaiser Permanente performance improvement mentor in Southern California. “It’s mostly about before and after, addition and subtraction.”

2) Whether you acknowledge it or not, you collect data every day.  

 “My role in the tests of change has been soliciting feedback from the patients,” says Hitt, the Moreno Valley optician. She didn’t need a computer program or spreadsheet. A piece of paper and pencil did the trick. 

 “We are all data collectors,” proclaims Stacy Dietz, the UBT consultant for regional operations in Southern California. “And every day, we alter our behavior based on data.” For instance, we ask, “What is the temperature outside?” Then we decide whether to wear a wool turtleneck or tank top. We ask, “What is the length of my commute?” Then we decide whether it makes more sense to drive or take the train.

If you can collect and analyze data to determine your wardrobe, you can also do it to improve the performance of your team.

3) Before diving into the numbers, focus on the “why.”

As the new Kaiser Permanente ads challenge viewers, “Find your motivation.” For unit-based teams, the Value Compass offers a handy cheat sheet on motivation: The patient is at the center. Every data point on every chart represents the impact—positive or negative—that a Kaiser Permanente team had on a patient.

IHI’s Bob Lloyd explains there are three distinct reasons in health care for collecting and examining data:

  • For research, such as KP’s recent study that found women in their late 60s who break a bone are five times more likely to die within a year than women that age who do not break a bone.
  • For judgment, a category that would include the federal government’s recent rankings of Medicare insurance plans on quality and service (several KP plans got five out of five stars). This category also includes scores that determine whether or not a medical center or department earns its Performance Sharing Program (PSP) bonus.
  • For improvement.

This last is the reason UBTs should be collecting and examining data.

 “The purpose of measurement in quality improvement work is for learning, not judgment,” Lloyd says. 

Data answers questions like, “How are we doing right now?” “Over time, are we getting better? Or getting worse?” “Is our small test of change making a difference? Or not?” In the absence of data, we have a tendency to fall back on relying on guesses, gut instinct, anecdotes—and to blame or give credit to specific individuals, justifiably or not.

 “You need data. Otherwise, you don’t have any solid information,” Hitt says. “You just have word of mouth.”

4) Only gather the data you actually need.

The holy grail of data for UBTs is the run chart. Don’t let the name throw you. It’s simply a chart that tracks some number (say, a service score, or number of last-minute sick calls) over time (day, week, month, quarter).

 “The most crucial question to ask is, ‘What are the few, vital pieces of information that are important?’ ” says Dennis Benton, executive director of the Panorama City Medical Center in Southern California. Any graph or data set that requires its intended audience to get special training to read is probably too complex for the task at hand, he says.

 “You can do a quick, just-in-time training at a UBT meeting,” says Benton. “We do it in leadership rounds. I point to the graphs and talk about them.” 

Run charts make it clear at a glance how your team's tests of change are working. Use this tool to walk through how to make one.

4 1/2) But, get the data often enough to support your improvement efforts.

For most teams’ small tests of change, data that can be collected daily, weekly or—at most—monthly will be most useful. Waiting for quarterly reports is generally not going to cut it. The Moreno Valley Optometry department did not wait for the Ambulatory Service Questionnaire results—which are posted monthly—to come in. It’s called the Rapid Improvement Model, folks. Not the Slow-as-Molasses Improvement Model.

Bottom line: The data should be useful for the team and be determined by the team.

5) Think art class, not math class.

 “I hate numbers,” admits Jenny Yang, a receptionist at the Moreno Valley Optometry department and a member of the UBT’s representative group. When the notion of using service scores to guide improvement first came up, Yang says she told her teammates, “I’m not going to do it. Make someone else do it.”

To help others like Yang, Benton says, when it comes to data, “Make a picture out of it. I am a big believer in graphs. With a graph, you can say, ‘We dipped here. What is the reason? What can we do about it?’ You can look at a trend relative to the goal.”

 “Graphs are visual,” Valencia adds. UBT members have a variety of learning styles and preferences: “Everyone learns differently.”  

And think in terms of moving video, not still photographs that capture single moments in time. IHI’s Lloyd asks, would nurses measure an ICU patient’s vital signs only when the patient arrived and when she left the unit? Or would they monitor vitals constantly via a telemetry machine? The second option is better, so caregivers can intervene in real time to help the patient’s recovery.  

6) You didn’t like art class? How about creative writing?

Numbers can tell a story. “There is narrative in data,” says Nancy Duarte, the author of “Slide:ology” and “Resonate,” two popular books about how to give compelling and memorable presentations. “What makes the numbers go up and down? How big are the numbers? How do the numbers contrast with other information?”

Yang agrees. Graphs with data “give you key points, high points and low points and trends,” she says. As a member of the representative UBT, Yang—a member of Steelworkers Local 7600—sees herself as a storyteller: “My audience is the UBT. The graphs help UBT members make sense of everything.”

Hey, if you liked math class, more power to you. “I love math,” says Hitt. “I am a number cruncher. But for me, charts and graphs? Not so much.”

7) It’s OK to ask for help.

So that graph you pored over in your UBT meeting is still making you break out into a cold sweat?

 “It’s OK to find a safe place to say, ‘I don’t get this,’ ” says UBT consultant Stacy Dietz. That might not be in a big group, but it could be one on one with a trusted peer.

Mertens, the Southern California performance improvement mentor, says the best way to learn to use data is to try it out. At the request of Susie Bulf, a UBT consultant, Mertens led a training for UBT co-leads in Fontana on how to create a run chart. He led an in-class exercise using sample data—and then another exercise where each team used its own data.

 “You get over the anxiety by doing it the first time,” Mertens says.

Each KP region boasts a roster of experienced performance improvement mentors. In addition, most UBT consultants have had some training in performance improvement strategies.


Closing the Gap

Deck: 
Path to Performance is challenging. Here’s how Fresno tackled training and sponsorship.

Story body part 1: 

“What’s holding you back?”

Fresno Medical Center leaders asked their 50 unit-based teams that question directly late last year, at the same time they asked the teams to assess themselves on the new Path to Performance standards.

The answers mirrored what facilities everywhere say are challenges: training and sponsorship. Of the seven attributes of high-performing teams laid out in the Path to Performance, those two are consistently the most problematic.

Across the organization, many teams had their Path to Performance ranking lowered as a result of the 2010 year-end assessment—including Fresno, which UBT Tracker identified as having the highest percentage of high-performing teams in the organization. Fresno saw its number of Level 5 teams drop by more than half, from 27 to 14.

But Fresno had a plan for 2011.

“Early on, when we got a look at the Path to Performance, we created a strategy,” says Rick Senneway, Fresno’s director of performance improvement. “The Path to Performance helped focus us. (It) became very clear what we needed to work on.”

Even before they had the assessment results, Fresno leaders devised a 2011 UBT strategy for team development and performance improvement. It includes specific steps for moving teams at both ends of the spectrum along the Path to Performance.

“We’re engaged with our union partners at all levels,” says Jose DeAnda, medical group administrator. “At the UBT departmental level, (and) at the LMP Council level, by having each council member be a sponsor of UBTs and by having the sponsors report out at council meetings on how UBTs are performing.”

The goals were twofold: Move at least six teams up from Level 3 to Level 4 or 5 by the end of 2011, and help five teams achieve measurable improvement. Year-end assessments were not yet finalized when Hank went to press, but there’s optimism about the results.

“We did some good projects this year, and our affinity groups really helped,” says Navneet Maan, Fresno’s UBT consultant, referring to a system where teams working on similar projects met and shared ideas.

With a mandate to increase the number of high-performing teams by 20 percent in 2012, other teams and facilities might glean some ideas from Fresno’s three-pronged approach. 

Improve the support network for teams

One of the first things Fresno did was to revamp its sponsor network, including:

  • Assigning sponsors to work in labor and management pairs and matching them so they share similar work areas;
  • Reducing the number of teams sponsors work with to no more than four;
  • Establishing new agreements that give sponsors more flexibility for how they meet with teams (in person or via email); and
  • Setting quarterly deadlines for reporting on team status at LMP Council meetings.

The new agreements clearly defined expectations for sponsors, says Lynn Campama, Fresno’s assistant medical group administrator: “The role of the sponsor is about the performance of teams,” not about team management. “Everybody is accountable.”

Rather than trust that sponsors know how to be effective, Fresno used council meetings as a training opportunity. Sponsors received updated materials, ranging from a new form to help teams with meeting basics to information on the use of metrics and SMART (strategic, measurable, attainable, realistic/relevant, time-bound) goals. They also got forms to help collect team success stories and to help teams better manage UBT Tracker, the organization-wide system that helps teams report on and find effective practices.

In addition, “local resource network” members documented their particular expertise—be it UBT development, performance improvement, issue resolution and interest-based problem solving, attendance, service and workplace safety—and were assigned to teams needing that expertise.

“We took sponsorship to the next level,” says Lorie Kocsis, Fresno’s union partnership representative, LMP Council union co-lead and SEIU UHW member. “We tried to make their role easier for them to understand and to help them feel that they aren’t alone.”

Ron Barba, the director of the outpatient pharmacy and sponsor for the respiratory, inpatient and outpatient and surgery specialties teams, has noticed the difference.

“They gave us the training we needed to help the teams,” Barba says. “I feel more effective.”

Improve team training

To address training gaps identified by the teams, Fresno developed a brochure that puts all the offerings in one place—classroom, “just in time” and web-based training available through KP Learn—and groups the offerings by audience. That makes it easy to see what’s available for team members and what’s there for union and management co-leads.

At the same time, a request form for just-in-time training was developed, and both the brochure and the form were posted on Fresno’s intranet website. A clear process for requesting training was put in place, with team members instructed to submit their requests to Kocsis and Maan.

It didn’t stop there: Teams also got training in key partnership and performance improvement methods. A one-hour, just-in-time version of the eight-hour Consensus Decision Making (CDM) course was conducted with teams that requested or needed it. Teams working on non-payroll projects, such as reduction of inventory, were encouraged to take Northern California’s new business literacy training.

“Training had been one of our big downfalls keeping teams from higher performance,” says Debby Schneider, Fresno’s LMP consultant.

The brochure has heightened awareness of what’s available.

 “It helps us see at a glance what we need to take,” says Jeannine Allen, the administrative services supervisor and co-lead for the Adult Medicine UBT. “It’s been kind of a road map.”

Prioritize projects

To maximize the teams’ performance improvement impact, Fresno guided them toward projects that were achievable, would impact facility or regional goals, and were aligned with the Value Compass.

Teams used a  prioritization matrix to help them pick projects. That exercise sharpened teams’ focus and enabled members to “see how the work they are doing impacts the entire service area—not just their departments,” says Maan.

Teams shared ideas with their sponsors, who connected teams with other resources, including the experts in the newly established local resource networks and the affinity groups.

The experience of the Health Information Management team illustrates why such connections are invaluable. Its SMART goal was to improve customer service by way of a survey. Jeremy Hager, a care experience leader, was assigned to help the team.

He introduced the fishbone diagram to the team co-leads to help them identify which metrics the team should focus on to reduce customers’ complaints. He also helped them correctly interpret survey data

The affinity groups also helped teams. The six unit-based teams that made attendance a priority, for example, received tips, tools and specific training around the “six essentials of good attendance” identified by Ann Nicholson, LMP attendance leader for Northern California.

They also looked at their data going back several years, which “really made a difference,” says Eileen Rodriquez, assistant manager for OB/GYN. “It was an ‘aha’ moment.”

The team is meeting its attendance goals. With 6.17 sick days per full-time employee as of the first pay period in December, the team members exceeded the region-wide goal of 6.50. What made the difference? Managers are more flexible, and workers are more aware of the impact of missed days.

Staff members “feel comfortable coming to us,” says Norma Costa, department manager—and the team’s union co-lead, Lisa Madrigal, a medical assistant and SEIU UHW member, concurs.

“I know that if I need to take time off, I can go to my manager and talk with her about it and that she’ll do everything she can to accommodate me,” Madrigal says.

What's next?

Attendance will continue to be a focus of the facility’s UBT strategy for 2012—as will making it easier to use UBT Tracker. Refreshers on UBT basics will be provided, new tools introduced, and new affinity groups created.

And while local union steward elections will affect the sponsor pairings, sponsors will continue to get training and will continue to serve on the LMP Council in labor and management pairs.

TOOLS

All in a Day's Work: Working in Partnership

Format:
PDF (color or black and white)

Size:
7.25" x 7.25" (prints out on 8.5" x 11") 

Intended audience:
Anyone with a sense of humor

Best used:
Share this with your team to emphasize the importance of working together collegially, 
regardless of rank.


Related tools:

Pages

Subscribe to RSS - hank